The Application of Graph Database Structures for Mapping Connections in Gambling Information Ecosystems
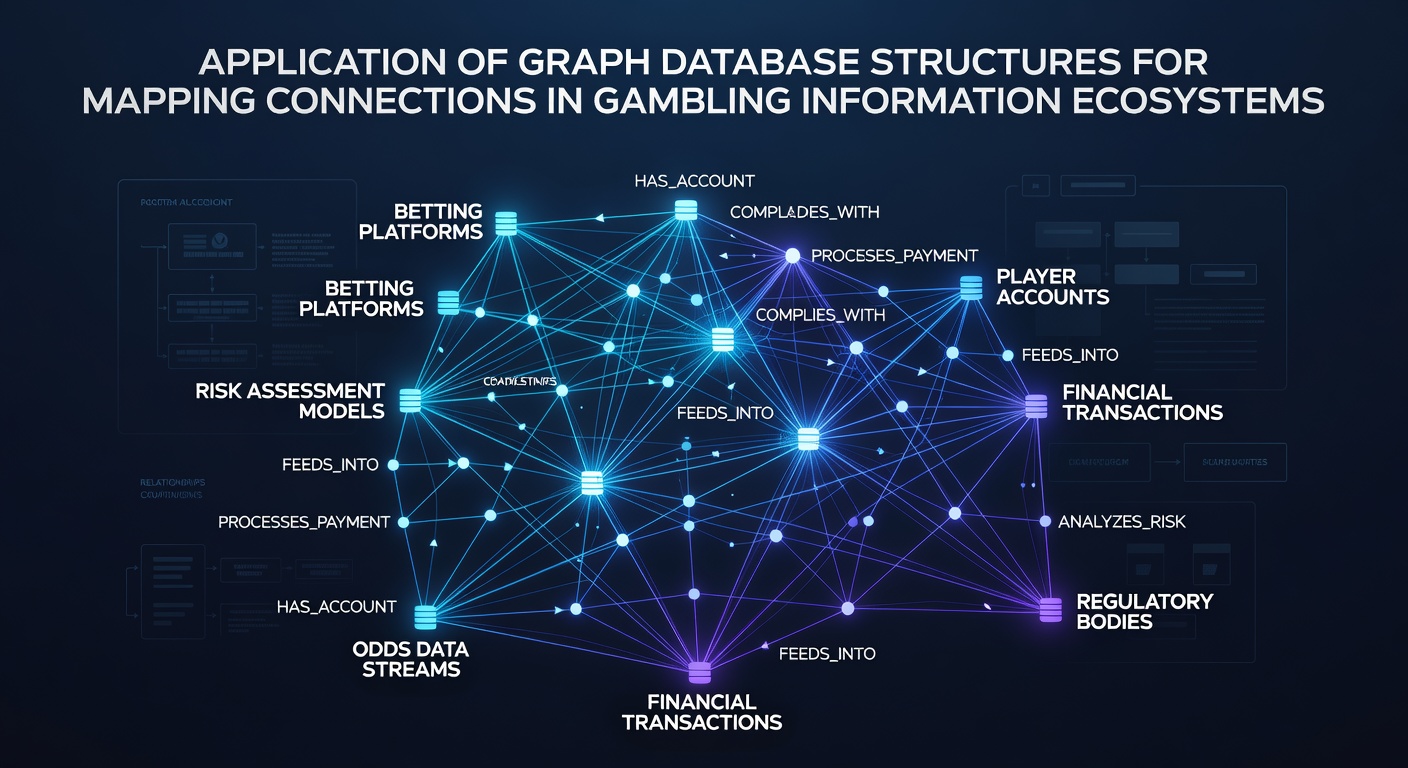
Graph database structures organize data as nodes and edges rather than rows and columns, allowing direct representation of relationships that appear throughout gambling information ecosystems. Operators track player accounts, affiliate networks, payment processors, and regulatory filings as connected entities, and this approach reveals patterns that traditional relational systems often obscure. Data indicates that graph models handle queries about multi-hop connections in milliseconds, whereas equivalent joins in conventional databases scale poorly beyond a few layers of depth.
Core Components of Graph Models in Gambling Contexts
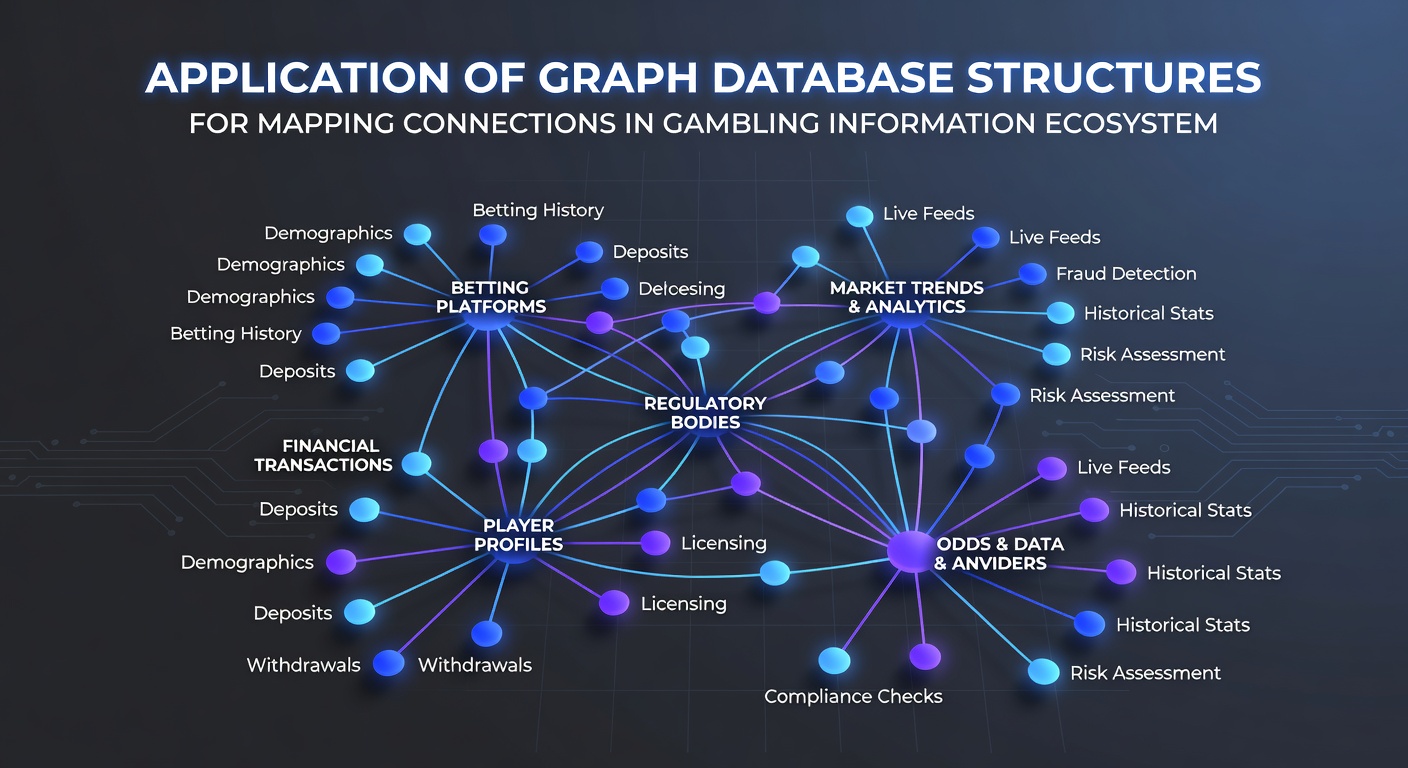
Nodes typically represent entities such as individual accounts, licensed operators, IP addresses, and device fingerprints, while edges capture actions like deposits, withdrawals, referrals, or shared banking details. Properties attached to both nodes and edges store timestamps, transaction amounts, and compliance flags. Researchers at institutions studying network analytics have documented how these properties enable traversal algorithms to flag clusters that share behavioral signals across multiple operators. One study from the Canadian Centre on Substance Use and Addiction examined anonymized transaction graphs and identified recurring cycles where funds moved through a small set of intermediaries before returning to source accounts.
Query languages such as Cypher or Gremlin allow analysts to express patterns like “accounts that received bonuses from the same affiliate and later transacted with the same crypto wallet within 48 hours.” Execution engines return result sets without scanning entire tables, which proves useful when datasets exceed tens of millions of records. Observers note that this efficiency supports real-time dashboards used by compliance teams during routine monitoring.
Fraud Detection and Regulatory Reporting Workflows
Regulatory bodies require operators to report suspicious activity involving linked accounts or unusual transfer chains. Graph traversals surface these chains by walking edges labeled “referred by” or “shared device,” then aggregating associated transaction volumes. In June 2026 several North American gaming commissions plan to accept graph-derived reports that include path visualizations alongside tabular summaries, reflecting growing acceptance of network evidence in enforcement proceedings.
Payment flow analysis benefits particularly from this structure. An edge representing a cryptocurrency transfer can connect a player node to an exchange node, then onward to another player node across jurisdictions. Analysts follow these paths to determine whether funds crossed restricted borders or passed through sanctioned addresses. Figures from the Nevada Gaming Control Board show that graph-assisted reviews reduced average investigation time for multi-account cases by approximately 35 percent during the 2024–2025 reporting period.
Integration with Existing Data Pipelines
Most gambling platforms already maintain relational databases for transactional integrity and audit logs. Graph databases sit alongside these systems through extract-transform-load processes that copy selected entities and relationships into the graph layer. Change-data-capture streams keep the two stores synchronized without requiring operators to rewrite core applications. Companies that adopted this hybrid architecture report that read-heavy analytics workloads shift to the graph store while write-heavy operations remain in the relational system.
Schema evolution remains straightforward because graph models accommodate new node types or edge labels without altering existing structures. When a new regulatory requirement appears, such as mandatory tracking of responsible-gambling self-exclusion lists across operators, administrators simply introduce a new edge label and begin populating it from existing data feeds.
Scalability Considerations and Performance Metrics
Production deployments often partition graphs by geographic region or license type to keep traversal latency low. Benchmarks published by database vendors indicate that clusters handling 500 million nodes and 2 billion edges maintain sub-second response times for typical regulatory queries when indexes cover frequently traversed properties. Horizontal scaling through sharding allows operators to add capacity as player bases grow, particularly in markets that legalized online wagering after 2022.
Memory requirements rise with graph size, yet many deployments keep hot subgraphs in RAM while colder historical data resides on disk. This tiered approach supports both operational dashboards and longer-term research projects that reconstruct network states from prior quarters.
Conclusion
Graph database structures supply a practical method for representing and querying the dense web of relationships that define modern gambling information ecosystems. Their adoption continues alongside regulatory demands for faster detection of linked accounts and coordinated activity. As data volumes expand and cross-border operations increase, the ability to traverse connections directly offers measurable advantages in both compliance speed and analytical depth.